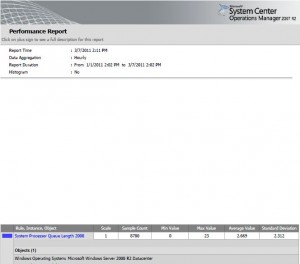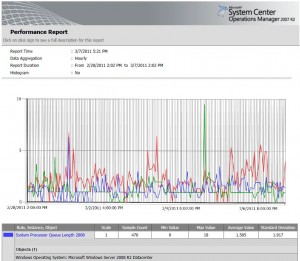
After having that issue at a customer,
I found a blog (http://gefufna.wordpress.com/2010/12/27/no-graphs-charts-are-included-in-scheduled-scom-reports/)
and a corresponding kb article at Microsoft that describes that behavior.
http://support.microsoft.com/kb/972821/en-us
Not mentioned in the kb article is, that the written code has to be place between the <runtime> </runtime> section of the reportingservices.exe.xml file.
Also you have to be sure that the code is placed next to existing <dependentAssembly></dependentAssembly> sections if they already exist.
And, at least, the reporting services have to be restarted.
If the reporting services do not start up right after your modification, you wrecked up the xml structure.
When everything works fine, the report shows the graph like it does in the interactive view.

COMMENTS